
1What are the coaching funnel benchmarks for 2026?
| Stage | Benchmark | Sample | Type |
|---|---|---|---|
| Booking page view to booked call | 48.6% | 1,366 views, 664 booked calls, one page | Measured |
| Booked calls cancelled | 11.6% | 749 booked calls, all client accounts | Measured |
| Booked calls rescheduled | 4.5% | 749 booked calls, all client accounts | Measured |
| Show rate | 71% of booked calls | Client portfolio | Founder-reported |
| Close rate | 32% of calls held | Client portfolio | Founder-reported |
| Average order | $6,500 | Client portfolio | Founder-reported |
2How many booked calls cancel or reschedule?
We counted every call booked through our schedulers across all client accounts in the 120 days to 2 November 2026. There were 749.
| What happened to the booking | Share of 749 booked calls |
|---|---|
| Cancelled | 11.6% |
| Rescheduled | 4.5% |
| Not cancelled | 88.4% |
So roughly 1 in 9 booked calls cancels before the call. A cancelled call is not a lost lead. Someone who cancels can still be rebooked if a setter calls them the same day.
Want the reminder sequence we use? Get the show rate and pre-call sequence Claude skill.
3What is a good booking page conversion rate?
On one client's booking page, 1,366 page views turned into 664 booked calls over three months. That is 48.6%.
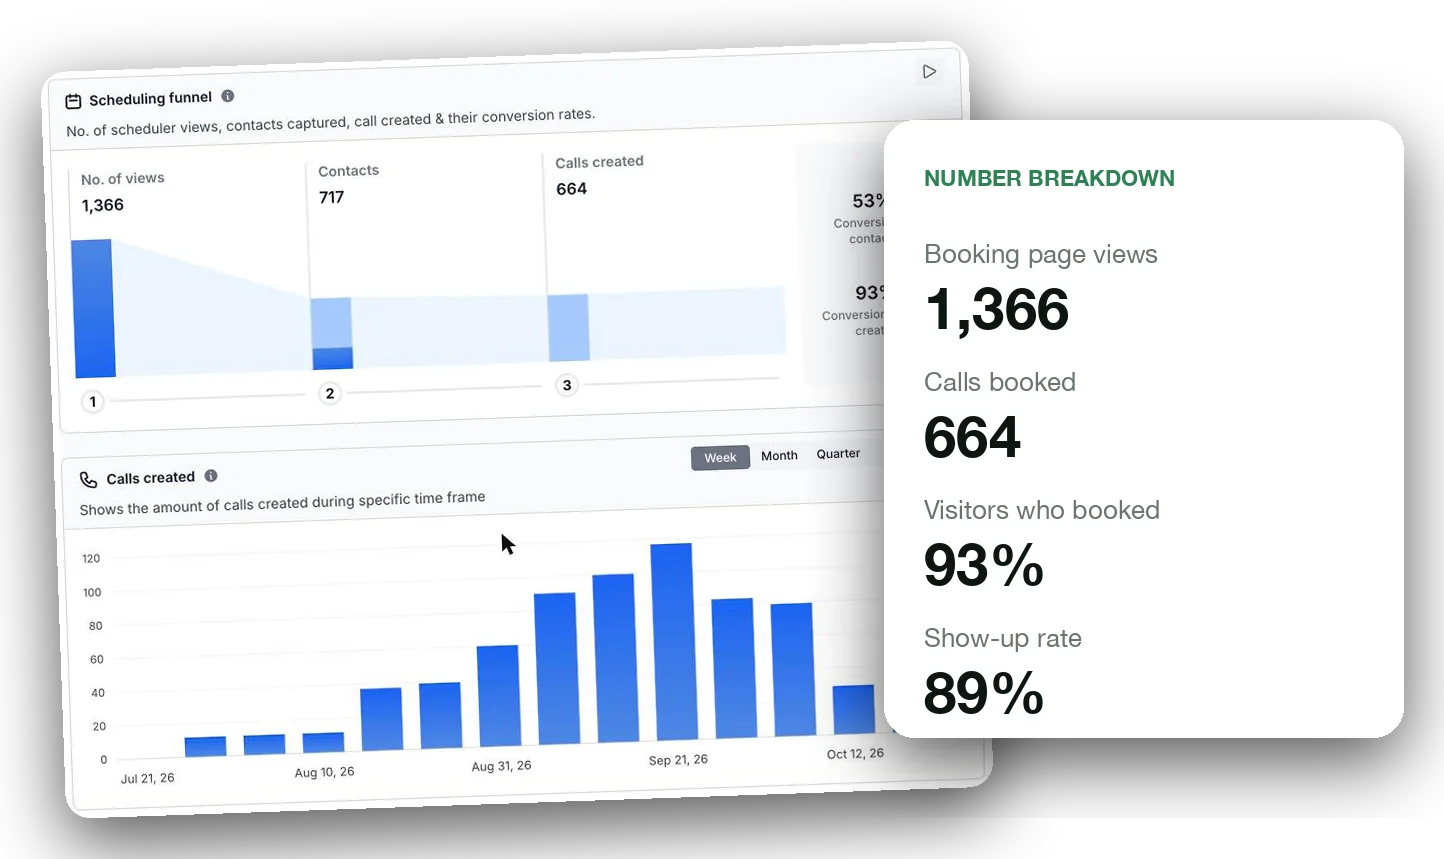
Three months, one client. Not typical.
The people who reach a booking page have already watched a webinar or a VSL, so they arrive warm. A cold page will convert far less: across 41,000+ landing pages, Unbounce's 2024 benchmark put the median conversion rate at 6.6%. If yours turns under about a third of its views into calls, cut the questions before the calendar to the few that qualify a buyer.
4What show rate, close rate and order size should you expect?
These three figures are reported by our founder across the client portfolio. They are not counted call by call in one system, so use them as a target to compare against.
| Per 100 booked calls | Number | How it is worked out |
|---|---|---|
| Calls that show up | 71 | 100 × 71% |
| Sales | about 22.7 | 71 × 32% |
| Cash from those sales | about $147,680 | 22.72 × $6,500 |
| Cash per booked call | about $1,476.80 | $147,680 ÷ 100 |
| Cash per call that showed | $2,080 | 32% × $6,500 |
The last two rows are the most useful. They tell you what you can afford to pay for a booked call before the ads stop paying for themselves.
The most you can pay assumes you keep about 30% of each booked call's value for ads. Change that to fit your margin. Check the full maths with the ROAS calculator.
See If You Qualify
We'll look at your offer and your funnel together and tell you what we'd fix first.
5What did individual funnels do?
Single cases, from client payment dashboards. They show what is possible, not what is typical.
| Funnel | Metric | Number | Case |
|---|---|---|---|
| Cold traffic webinars, new offer | Cash collected | $0 to $1,230,101 in 60 days | $0 to $1.23M webinar case |
| Cold traffic webinars, new offer | Best single day | $102,500 | The $102,500 day, in the webinar case |
| Live webinar on cold Meta ads | Cost per click | $1.35 | Cold Meta ad costs, click by click |
| Live webinar on cold Meta ads | Cost per registration | $7.08 | The $7.08 webinar sign-up breakdown |
| Live webinar on cold Meta ads | Cash before the webinar | $40,000 on $710 net spend (56x) | $40,000 on $710 of ads case |
| Webinar into booked calls, $15,000 B2B offer | Cost per booked call | $66, before retargeting | $66 per booked call B2B case |
| Free Skool group with a paid tier | Free to paid members | 659 paying $697 a year, from 23,403 free | Skool community revenue case |
| Creator, low-ticket front end into high ticket | Cash per month | $40,000, then $75,000, then $95,000 | Low ticket to high ticket creator case |
| Nurture to an unworked list | Cash in 10 days | £16,000 | £16,000 from a cold list case |
| Annual membership on a front end | Recurring revenue | $0 to $143,000 a year | Annual membership case |
6Where does each number come from?
| Number | Type | Source | Window |
|---|---|---|---|
| 749 booked calls, 11.6% cancelled, 4.5% rescheduled | Measured | Our booking system: every call booked through our schedulers, all client accounts | 120 days to 2 Nov 2026 |
| 1,366 views, 664 booked calls, 48.6% | Measured | The booking report for one client's booking page (image above) | Three months |
| 71% show rate, 32% close rate, $6,500 average order | Founder-reported | Stated by our founder across the client portfolio. Not counted call by call in one system. | Portfolio to date |
| Per 100 calls and cash per booked call | Worked out | Arithmetic on the founder-reported figures, shown in the table | Same |
| Case figures | Single cases | Client payment dashboards and ad accounts, shown on each case page | Stated on each case page |
What is not here: cost per lead, webinar attendance and close rate measured call by call. Our booking system does not hold a complete outcome for every call yet, so we do not publish those as measured numbers.
The booking data counts calls booked through our own schedulers only. Calls booked on other tools, or directly by a setter, are not in the 749.
Quoting these numbers? Company facts and the founder bio are on the press page.
7How should you use these benchmarks?
- Pull last month's numbers. Calls booked, cancelled, showed, sold and the cash from those sales.
- Put them in the calculator above. It gives you what one booked call is worth and the stage furthest below the benchmark.
- Fix that one stage first. A lift in show rate or close rate makes every call you already pay for worth more.
- Then set your cost per booked call ceiling. Never pay more for a call than it is worth to you.
- Compare with yourself monthly. Your own trend beats any benchmark. The funnel math diagnostic Claude skill runs this review for you.
For the full funnel, read the coaching funnel guide and the show rate benchmarks.
To see which funnel these numbers fit, read our guide to funnel types.
Find the exact bottleneck in your business
Frequently asked questions
What is a good show rate for coaching sales calls?
Across the Cashflow Coaches client portfolio, the founder-reported show rate is 71% of booked calls. Treat it as a target to compare against, not a measured average. If fewer than 6 in 10 booked calls show up, fix reminders and confirmations before you buy more traffic.
What is a good close rate for high ticket coaching calls?
The founder-reported portfolio close rate is 32% of calls held, with a $6,500 average order. Close rates depend heavily on price, lead quality and the closer, so compare your number with your own last three months first.
How many booked sales calls get cancelled?
Of 749 calls booked through Cashflow Coaches schedulers across all client accounts in the 120 days to 2 November 2026, 11.6% were cancelled and 4.5% were rescheduled. That is measured data from the booking system.
What is a good booking page conversion rate?
On one client booking page, 1,366 page views turned into 664 booked calls, a 48.6% view to booking rate over three months. A page that converts under about a third of its views usually asks too much before the calendar or loads too slowly.
How much is one booked call worth?
At a 71% show rate, a 32% close rate and a $6,500 average order, one booked call is worth about $1,476.80 in sales. Multiply your own show rate, close rate and average order to get yours.
What should a booked call cost?
Less than what one booked call is worth to you. In one case study a $15,000 B2B offer booked calls at $66 each before retargeting, so one sale covered about 227 booked calls.
Where do these coaching funnel benchmarks come from?
The booking and cancellation figures are measured in the Cashflow Coaches booking system. The show rate, close rate and average order are founder-reported portfolio figures. The case figures come from client payment dashboards shown on each case study page.
Can I use these benchmarks in my own content?
Yes. Quote the figures with a link to cashflowcoaches.io/coaching-funnel-benchmarks and keep the label that says whether a number is measured or founder-reported.

$10M+ in client results. I founded and run Cashflow Coaches, a done-for-you marketing, sales, operations and tracking agency. We handle everything from paid ads, funnels, webinars, VSLs and Skool communities to setters, closers, ops and tracking. Two-time Skool Games winner (top 10 of 87,000+ entrepreneurs) and a London School of Economics graduate.
Keep reading: Show rate benchmarksCoaching funnelsCAC calculatorCase studiesReviews and results
Measured figures are from the Cashflow Coaches booking system, pulled on 2 November 2026. Founder-reported figures are labelled. Every case result is a past result from a specific client. None of them is typical, and none is a promise of yours.